Forex charts are one of the most important tools in a trader’s arsenal. Understanding how to read and analyze these charts is crucial for making informed trading decisions. Whether you’re just starting or looking to refine your skills, this guide will walk you through the basics of reading forex charts, focusing on candlestick patterns, support and resistance levels, moving averages, and key technical indicators.
1. Candlestick Patterns: The Basics
Candlestick charts are the most popular type of forex chart used by traders. Each candle represents the price movement of a currency pair during a specific time period, and the shape of the candle gives you a lot of information. Here’s how to interpret them:
-
Body
- The rectangular part of the candle. A large body indicates a strong price movement in either direction.
-
Wicks
- These are the thin lines above and below the body. They represent the highest and lowest prices during the time period.
-
Colors
- A green (or white) candle typically means the price closed higher than it opened, while a red (or black) candle indicates the price closed lower than it opened.
-
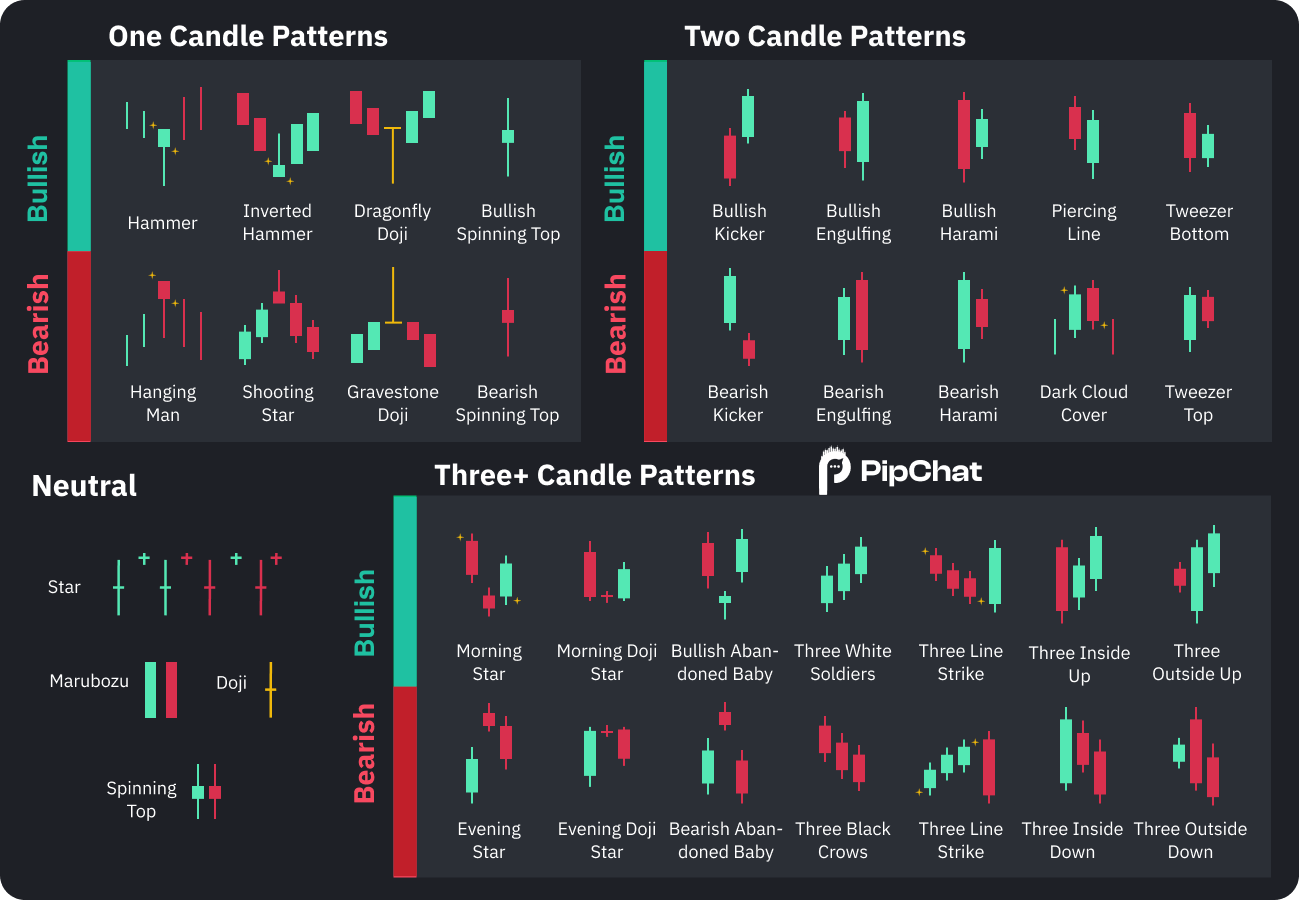
Key Candlestick Patterns to Watch:
- This candle has little to no body, indicating indecision in the market.
- A larger candle fully engulfs the previous one, signaling a potential reversal in price.
- A candle with a small body and a long lower wick, signaling potential bullish reversal.
-
Doji
-
Engulfing Pattern
-
Hammer
2. Support and Resistance Levels
Support and resistance are key levels on a chart where the price tends to stop and reverse direction.
-
Support
- A price level where the currency pair has a tendency to stop falling and reverse upward. Think of it as the “floor” for the price.
-
Resistance
- A price level where the currency pair tends to stop rising and reverse downward. This acts as the “ceiling” for the price.
Traders use support and resistance to identify entry and exit points. If the price breaks through these levels, it could signal a strong continuation in that direction.
Key Tip: Look for multiple tests of a support or resistance level. The more times a price bounces off these levels, the stronger they become.
3. Moving Averages: Identifying Trends
Moving averages are one of the simplest yet most effective technical indicators. They help traders smooth out price data and identify trends over time.
-
Simple Moving Average (SMA)
- The average price over a set period of time (e.g., 50 days). A rising SMA suggests a bullish trend, while a falling SMA points to a bearish trend.
-
Exponential Moving Average (EMA)
- This gives more weight to recent prices, making it more responsive to new data.
Traders often use moving averages to confirm trends and as dynamic support and resistance levels. For example, when the price crosses above a 200-day SMA, it can signal a bullish trend.
Key Tip: Use moving averages in combination with other tools to get a clearer picture of market direction.
4. Technical Indicators: RSI and MACD
Technical indicators provide additional insights into market conditions. Two popular indicators are:
-
Relative Strength Index (RSI)
- This measures the speed and change of price movements, oscillating between 0 and 100. When RSI is above 70, it indicates the market is overbought, while a reading below 30 suggests it's oversold.
-
Moving Average Convergence Divergence (MACD)
- This is a trend-following indicator that shows the relationship between two moving averages. When the MACD crosses above its signal line, it suggests a bullish trend; when it crosses below, it signals a bearish trend.
Key Tip: Use indicators like RSI and MACD to confirm what the charts are telling you, but avoid relying solely on them for decisions